This website contains additional material from the paper “Assignments as influential factor to improve the prediction of student performance in online courses”.
Abstract
Studies on the prediction of student success in distance learning have explored mainly demographics factors and student interactions with the virtual learning environments. However, it is remarkable that a very limited number of studies use information about the assignments submitted by students as influential factor to predict the impact on student achievement. This paper aims to explore the real importance of assignment information for solving students’ performance prediction in distance learning and evaluate the beneficial effect of including this information. We investigated and compared the use of this factor using both traditional representation and a more flexible representation based on Multiple Instance Learning (MIL) that can handle weakly labeled data. A comparative study using the Open University Learning Analytics Dataset, one of the most important online universities of United Kingdom, and a wide and different type of machine learning algorithms shows that algorithms using only information about assignments with a representation based on MIL can outperform more than 20% the accuracy with respect to the use of a representation based on single instance learning. Thus, it is found that using an appropriate representation that eliminates the sparseness of data allows to show the relevance of this factor. Moreover, algorithms using only information assignments as impact factor obtain better results compared to those obtained by previous studies that solve the same problem exploring other factors.
Datasets
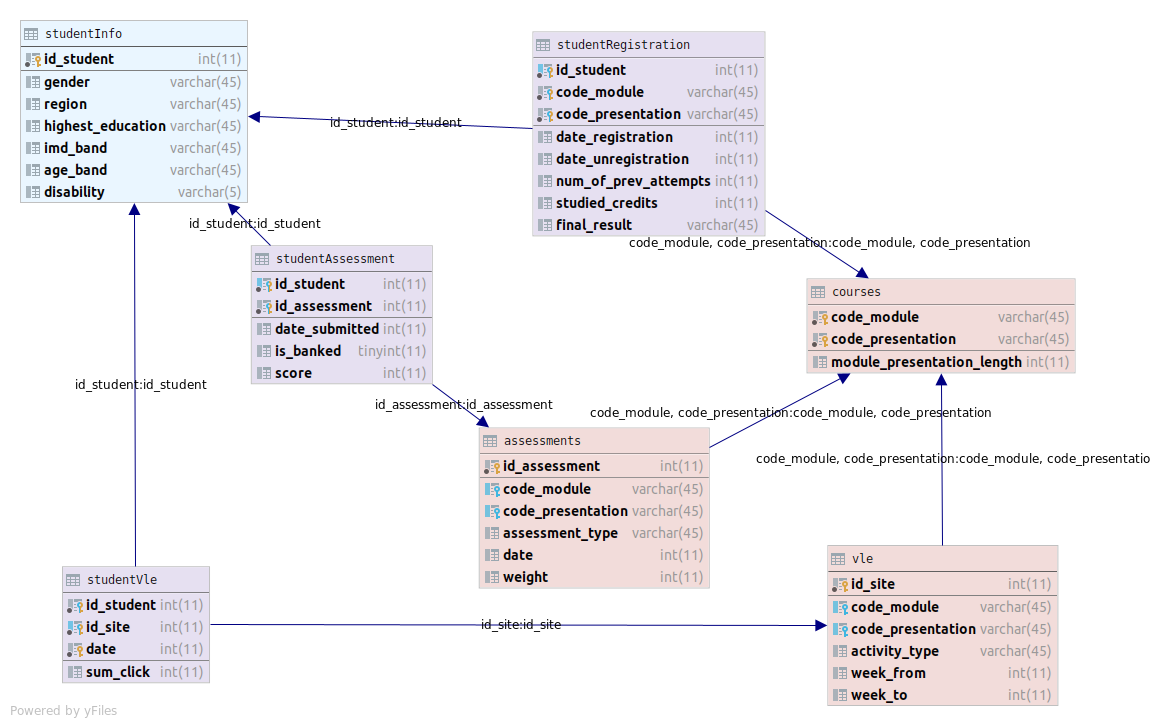
All the datasets used in this work come from the Open University Learning Analytics Dataset (OULAD), but have been processed in order to adapt them to this study. The new structure of the database from which datasets have been generated is the following.
There are two approaches: multiple instance and single instance, and, for each one, the information has been split into the 7 courses exiting in the dataset, merging all their presentations. So there are 14 datasets in ARFF format that summarize the information related to the submitted assignments by the students in each course following two distinct approaches.
Multiple Instance Datasets
| Dataset | Course | #Bags | #Positive bags | #Negative bags | Avg instances per bag | #Instances | #Attributes |
|---|---|---|---|---|---|---|---|
| mil-assessment-binary-nomiss-AAA | AAA | 705 | 530 | 175 | 4.47 | 3149 | 5 |
| mil-assessment-binary-nomiss-BBB | BBB | 6077 | 3754 | 2323 | 7.08 | 43032 | 5 |
| mil-assessment-binary-nomiss-CCC | CCC | 3413 | 1677 | 1736 | 4.98 | 17025 | 5 |
| mil-assessment-binary-nomiss-DDD | DDD | 4940 | 2607 | 2333 | 5.63 | 27820 | 5 |
| mil-assessment-binary-nomiss-EEE | EEE | 2298 | 1649 | 649 | 3.43 | 7893 | 5 |
| mil-assessment-binary-nomiss-FFF | FFF | 6294 | 3648 | 2646 | 8.71 | 54815 | 5 |
| mil-assessment-binary-nomiss-GGG | GGG | 2112 | 1514 | 598 | 7.21 | 15219 | 5 |
Simple Instance Datasets
| Dataset | Course | #Instances | #Positive instances | #Negative instances | #Attributes |
|---|---|---|---|---|---|
| simple-assessment-binary-nomiss-AAA | AAA | 705 | 530 | 175 | 51 |
| simple-assessment-binary-nomiss-BBB | BBB | 6077 | 3754 | 2323 | 191 |
| simple-assessment-binary-nomiss-CCC | CCC | 3413 | 1677 | 1736 | 81 |
| simple-assessment-binary-nomiss-DDD | DDD | 4940 | 2607 | 2333 | 156 |
| simple-assessment-binary-nomiss-EEE | EEE | 2298 | 1649 | 649 | 61 |
| simple-assessment-binary-nomiss-FFF | FFF | 6294 | 3648 | 2646 | 241 |
| simple-assessment-binary-nomiss-GGG | GGG | 2112 | 1514 | 598 | 136 |
Experimental study
This section presents a more extend study to support the results showed in the paper. First it is described the study of the configuration of the multi-instance proposals. Then, it can be found the complete experimentation of the comparative study between the two multi-instance proposal and the simple instance approach.
Study of the configuration of multi-instance proposals
The objective of the study is to evaluate the different alternatives for carrying out the transformation of the wrapper methods and determining which one works better in this problem. Regarding to SimpleMI and due to the characteristics of the data, two different methods for transforming the problem are studied:
- Configuration 1: computing arithmetic mean of each attribute using all instances of the bag and using it in the summarized instance.
- Configuration 2: computing geometric mean of each attribute using all instances of the bag and using it in the summarized instance.
Regarding to MIWrapper, three different methods for transforming the problem are studied:
- Configuration 1: computing the arithmetic average of the class probabilities of all the individual instances of the bag.
- Configuration 2: computing the geometric average of the class probabilities of all the individual instances of the bag.
- Configuration 3: checking the maximum probability of single positive instances. If there is at least one instance with its positive probability greater than 0.5, the entire bag is positive.
This problem is focused in predict if a student will pass a course or, by contrast, he/she will fail or drop out it. Thus, the performance of every studied algorithm is measured in terms of binary classification. Specifically, for the configuration of the proposed wrappers we focus on the accuracy of the classification, since the classes in the different datasets are pretty balanced. The experimentation consist of a 10-fold stratified cross-validation for every combination of wrapper configuration, algorithm and course. The full data can be downloaded in:
With the average accuracy of the cross-validation, a statistical analysis is carried out in order to find significant differences between configurations. The following table contains the results of Wilcoxon signed-rank test between the configurations of each wrapper in accuracy attending to the sum of ranks in which the first configuration outperforms the second one R+, the sum of ranks in which the second configuration outperforms the first one R-, and the p-value given a two-tailed probability of find significant differences between the two configurations. According with this value, the last column shows the obtained conclusions at a confidence level alpha=99%, since in all cases p-value is smaller than 0.01. In case of SimpleMI, test confirms that configuration 1 has significantly higher accuracy than configuration 2. Thus, in this problem it is better to summarize the bag with the arithmetic mean. In case of MIWrapper, tests shows that the third configuration is by far the worst option, while configurations 1 and 2 have a more evenly performance, although the configuration 1 finally obtains a significantly higher accuracy. That is, it is better to use the arithmetic mean to combine the class probabilities of instances into the final class bag.
| Wrapper | Comparison | R+ | R- | p-value | Conclusions at 99% level of confidence |
|---|---|---|---|---|---|
| SimpleMI | Config. 1 vs Conf. 2 | 12740.5 | 300.5 | 4.78e-25 | Config. 1 improves Config. 2 |
| MIWrapper | Config. 1 vs Config. 2 | 8274.0 | 4606.0 | 5.19e-4 | Config. 1 improves Config. 2 |
| Config. 1 vs Config. 3 | 12846.0 | 195.0 | 2.32e-25 | Config. 1 improves Config. 3 | |
| Config. 2 vs Config. 3 | 12847.0 | 194.0 | 2.28e-25 | Config. 2 improves Config. 3 |
Complete experimental results
The experimental study is composed of cross-evaluation of 23 algorithms over the 7 courses using the 3 different data representation: traditional single-instance and the two MIL wrappers. The cross-validation has 10 folds. Moreover, several algorithms are not deterministc, but sthocastics, so the experimentation has been repeated 5 times with different seeds. Specifically, 13 algorithms are in this situation. Thus, the final number of combinations is 7x3x10x(10+13×5) = 15750 experiments.
| Paradigm | Algorithm | Stochastic? |
|---|---|---|
| Methods based on trees | DecisionStump | No |
| J48 | No | |
| RandomTree | Yes | |
| RandomForest | Yes | |
| Methods based on rules | ZeroR | No |
| OneR | No | |
| NNge | No | |
| PART | No | |
| Ridor | Yes | |
| Naive Bayes | No | |
| Logistic | No | |
| Methods based on SVM | LibSVM | No |
| SPegasos | No | |
| SGD | Yes | |
| SMO | Yes | |
| Methods based on ANN | RBFNetwork | Yes |
| Multilayer Perceptron | Yes | |
| Methods based on ensembles | AdaBoostM1 with RandomForest | Yes |
| AdaBoostM1 with PART | Yes | |
| AdaBoostM1 with NaiveBayes | Yes | |
| Bagging with RandomForest | Yes | |
| Bagging with PART | Yes | |
| Bagging with NaiveBayes | Yes |
The full reports obtained for every combination can be downloaded bellow. The results are in CSV format, following the Weka style, since this is the framework used for the experimentation. The reports are grouped by representation, and inside each download, there are a CSV file by course with all the executions of all the algorithms and multiple performance metrics like accuracy, specificity and sensitivity among others. Moreover, for each course it is another file that summarizes the metrics used in the paper.